Note
Go to the end to download the full example code.
Exact L0 Sparsity Budgeting on Breast Cancer Dataset#
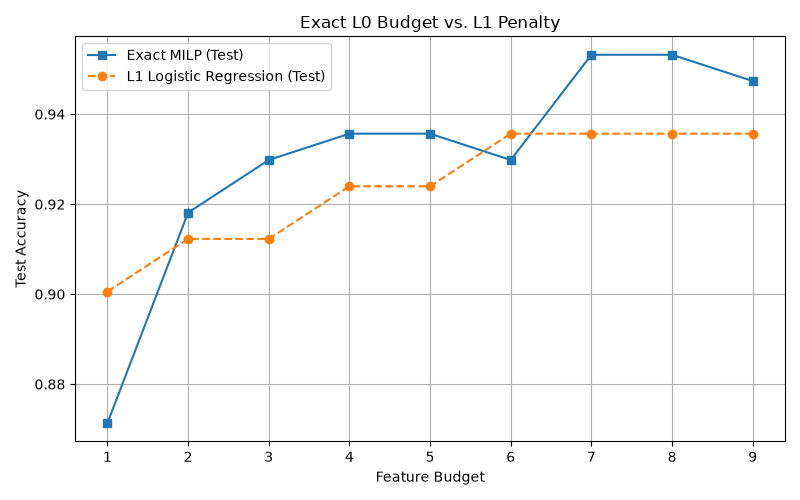
Demonstrates exact cardinality constraints via max_features against
an L1 Logistic Regression baseline on the Breast Cancer dataset.
import matplotlib.pyplot as plt
from sklearn.datasets import load_breast_cancer
from sklearn.feature_selection import SelectKBest, f_classif
from sklearn.linear_model import LogisticRegression
from sklearn.model_selection import train_test_split
from sklearn.pipeline import Pipeline
from sklearn.preprocessing import StandardScaler
from tlmnet import TlmMilpClassifier

data = load_breast_cancer()
X, y = data.data, data.target
X_train, X_test, y_train, y_test = train_test_split(
    X, y, test_size=0.3, random_state=42, stratify=y
)

k_budgets = range(1, 10)
tlm_scores, lr_scores = [], []

for k in k_budgets:
    # TLM Exact L0
    pipe_tlm = Pipeline(
        [
            ("select", SelectKBest(f_classif, k=15)),
            ("scaler", StandardScaler()),
            ("tlm", TlmMilpClassifier(max_features=k, C=1.0)),
        ]
    )
    pipe_tlm.fit(X_train, y_train)
    tlm_scores.append(pipe_tlm.score(X_test, y_test))

    # L1 Logistic Regression Baseline (Updated for Scikit-Learn 1.8+ API)
    pipe_lr = Pipeline(
        [
            ("select", SelectKBest(f_classif, k=k)),
            ("scaler", StandardScaler()),
            (
                "lr",
                LogisticRegression(solver="saga", l1_ratio=1.0, C=1.0, max_iter=5000),
            ),
        ]
    )
    pipe_lr.fit(X_train, y_train)
    lr_scores.append(pipe_lr.score(X_test, y_test))

plt.figure(figsize=(8, 5))
plt.plot(k_budgets, tlm_scores, "s-", label="Exact MILP (Test)")
plt.plot(k_budgets, lr_scores, "o--", label="L1 Logistic Regression (Test)")
plt.xlabel("Feature Budget")
plt.ylabel("Test Accuracy")
plt.title("Exact L0 Budget vs. L1 Penalty")
plt.legend()
plt.grid(True)
plt.tight_layout()
plt.show()
Total running time of the script: (0 minutes 4.798 seconds)