Note
Go to the end to download the full example code.
Decision Threshold Calibration: Precision, Recall, and F1 Trade-offs#
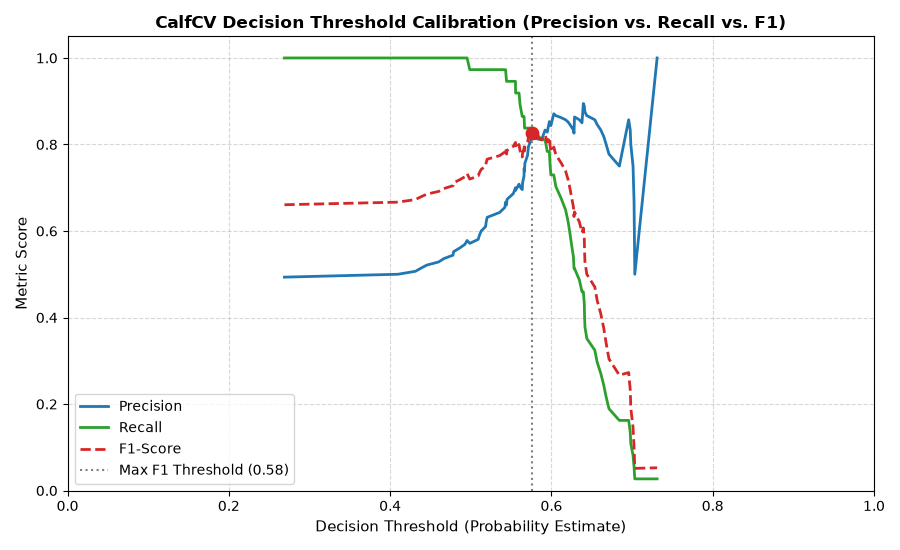
When a classifier generates continuous decision scores or probabilities, changing the decision threshold (the cutoff point where a score becomes a hard 0 or 1 classification) shifts classification metrics.
Moving the threshold up catches fewer positives (higher precision, lower recall),
while moving the threshold down catches more positives (lower precision, higher recall).
This example illustrates how Precision, Recall, and F1-Score dynamically trade off
across decision thresholds ranging from 0.0 to 1.0 for a trained CalfCV
estimator.
Imports and Synthetic Dataset Generation
import matplotlib.pyplot as plt
import numpy as np
from sklearn.datasets import make_classification
from sklearn.metrics import precision_recall_curve
from sklearn.model_selection import train_test_split

from calfcv import CalfCV

# Generate synthetic dataset scaled for rapid local/CI builds (N=250, P=50)
X, y = make_classification(
    n_samples=250,
    n_features=50,
    n_informative=20,
    n_redundant=10,
    n_classes=2,
    shuffle=False,
    random_state=42,
)

X_train, X_test, y_train, y_test = train_test_split(
    X, y, test_size=0.3, random_state=42, stratify=y
)
Fit CalfCV Estimator via Automated Grid Search
Compute Probabilities and Precision-Recall Curve CalfCV internally applies a sigmoid transformation to its integer-weighted sum decision scores to provide continuous probability estimates between 0 and 1.
probabilities = clf.predict_proba(X_test)[:, 1]

precision, recall, thresholds = precision_recall_curve(y_test, probabilities)

# Calculate F1-Score across all thresholds
f1_scores = 2 * (precision[:-1] * recall[:-1]) / (precision[:-1] + recall[:-1] + 1e-10)

# Identify threshold maximizing F1-Score
best_idx = np.argmax(f1_scores)
best_threshold = thresholds[best_idx]
best_f1 = f1_scores[best_idx]

print("\n" + "=" * 50)
print("THRESHOLD CALIBRATION METRICS")
print("=" * 50)
print(f"Optimal F1 Threshold: {best_threshold:.4f}")
print(f"Peak F1-Score:         {best_f1:.4f}")
print(f"Precision at Peak:     {precision[best_idx]:.4f}")
print(f"Recall at Peak:        {recall[best_idx]:.4f}")
==================================================
THRESHOLD CALIBRATION METRICS
==================================================
Optimal F1 Threshold: 0.5757
Peak F1-Score:         0.8267
Precision at Peak:     0.8158
Recall at Peak:        0.8378
Plot Precision, Recall, and F1 Trade-offs Across Thresholds
plt.figure(figsize=(9, 5.5))
plt.plot(thresholds, precision[:-1], label="Precision", color="#1f77b4", linewidth=2)
plt.plot(thresholds, recall[:-1], label="Recall", color="#2ca02c", linewidth=2)
plt.plot(
    thresholds,
    f1_scores,
    label="F1-Score",
    color="#d62728",
    linestyle="--",
    linewidth=2,
)

# Highlight peak F1 threshold point
plt.axvline(
    x=best_threshold,
    color="gray",
    linestyle=":",
    linewidth=1.5,
    label=f"Max F1 Threshold ({best_threshold:.2f})",
)
plt.scatter(
    [best_threshold],
    [best_f1],
    color="#d62728",
    s=80,
    zorder=5,
)

plt.xlabel("Decision Threshold (Probability Estimate)", fontsize=11)
plt.ylabel("Metric Score", fontsize=11)
plt.title(
    "CalfCV Decision Threshold Calibration (Precision vs. Recall vs. F1)",
    fontsize=12,
    fontweight="bold",
)
plt.legend(loc="lower left", fontsize=10)
plt.grid(True, linestyle="--", alpha=0.5)
plt.xlim(0.0, 1.0)
plt.ylim(0.0, 1.05)
plt.tight_layout()
plt.show()
Threshold Calibration Analysis#
Native Probability Estimates: CalfCV natively computes predict_proba by mapping its coarse integer-weighted sums through a sigmoid function. This provides calibrated probabilities suitable for continuous threshold tuning.
Precision-Recall Trade-off: In diagnostic contexts where false positives are costly, raising the threshold yields higher precision. In screening contexts where catching all positives is critical, lowering the threshold prioritizes recall.
Optimal Threshold Boundary (Vertical Dotted Line): The vertical dotted line highlights the exact cutoff that maximizes the F1-Score (the harmonic mean of precision and recall). This visually demonstrates whether the decision boundary needs to be tuned higher or lower than the default 0.50 cutoff for optimal metric balance on hold-out data.
Total running time of the script: (0 minutes 5.433 seconds)